My GeneSet

This browser allows you to examine the pattern of expression of a selected set of genes (up to 200) across some or all of the ImmGen expression data.
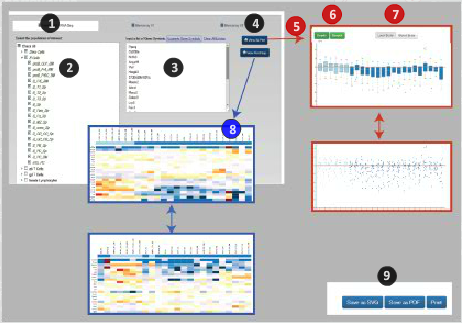
(1) First select the type of data to browse (RNAseq, Microarray V1/V2) by selecting the corresponding tab (RNAseq by default).
(2) Select the populations by navigating the ImmGen population tree.
(3) Input a list of Gene Symbols, can either copy/paste a list, or drag/drop the icon of a file in txt format.
(4) Click to choose one of representations.
- The Scatter plot (5) shows the means-normalized expression value of each gene in each selected cells. Toggle between the Dotplot or Boxplot (6) and local/ global scale (7).
- The interactive heatmap (8) in which the order of genes or populations can be rearranged.
The scatterplots and heatmap images can be downloaded as svg or PDF format, or sen to a printer (9).