
MicroRNA
Visualize MicroRNA abundance profiles
Switch between two types of analysis with top level tabs:
A microRNA expression across Immune Cell Types (Qiagen qPCR)
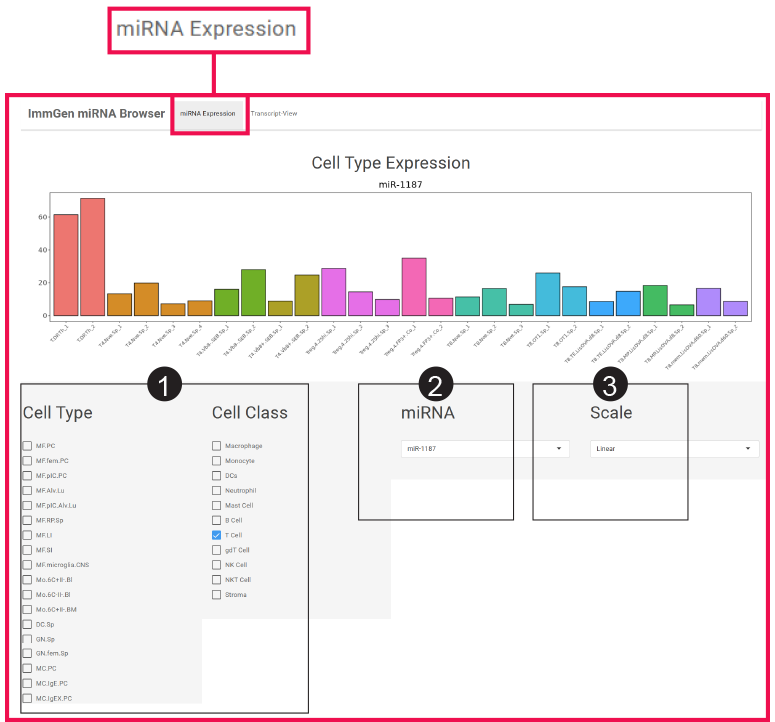
1 Select a cell type or lineage.
2 Enter a Gene Symbol to display the expression profile.
3 Select the scale between linear values, or log of means-normalized values.
B Predicted target sites on a chosen gene, for miRNA expressed in chosen cells.
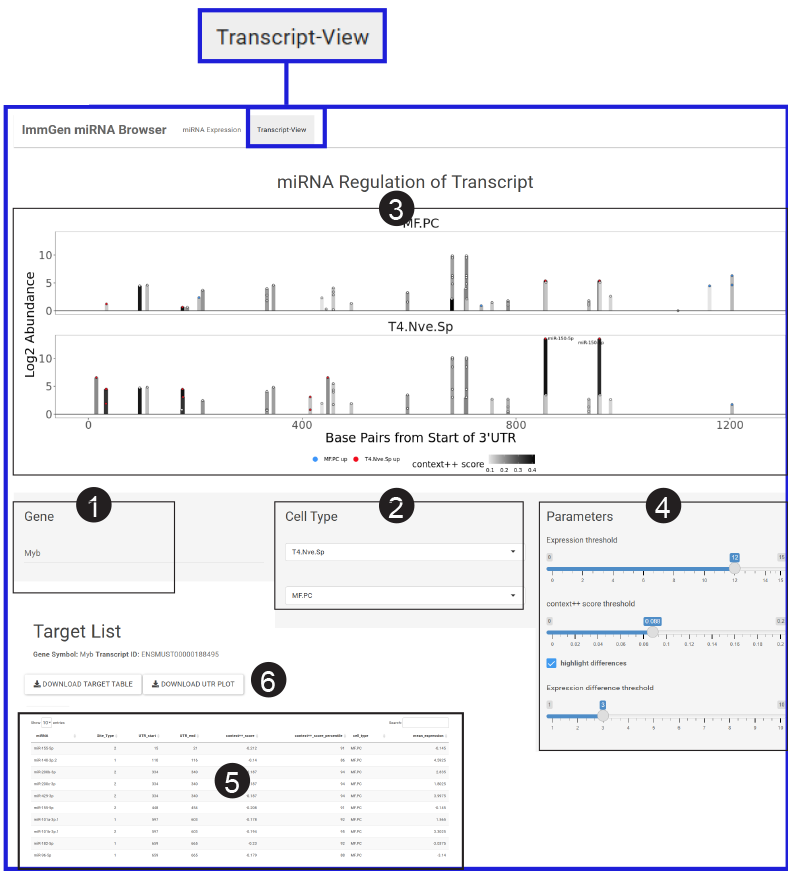
1 Enter a Gene Symbol for the target gene you wish to inspect.
2 Select up to 2 cell types to compare.
3 View microRNAs mapped along the gene transcript. Expression levels appear as bars at each miRNA target location.
4 Customize the graph display: Filter by expression or context ++ score (see Rose et al, Nat Immunology. 2021). Highlight differences between samples by setting a threshold.
5 A results table lists all predicted targets.
6 Download the target table or the graphic representation.