
Histone Code
1 Enter a Gene Symbol for the target gene you wish to inspect.
2 Select from this table the samples to display. (Click on all wanted). You may display up to 200 samples simultaneously, but realistically the output is more manageable with a dozen or less.
3 Enter a gene around which you want to view the histones profiles (official NCBI Gene Symbol).
4 Choose a display layout mode per UCSC standards (full, dense or pack). Group scaling will be used.
5 The annotation tracks will show the peaks called by analysis of OCR signal (“ImmGen Atlas) in the Josefowicz lab. Select which to show.
6 The annotation tracks will show the “Domains of Regulatory Chromatin (DORCs) that connect regulatory elements to gene expression, as called by analysis in the Buenrostro Lab. Select which to show.
7 Explore the data. Once in the browser, you can zoom in or out, move along the chromosome.
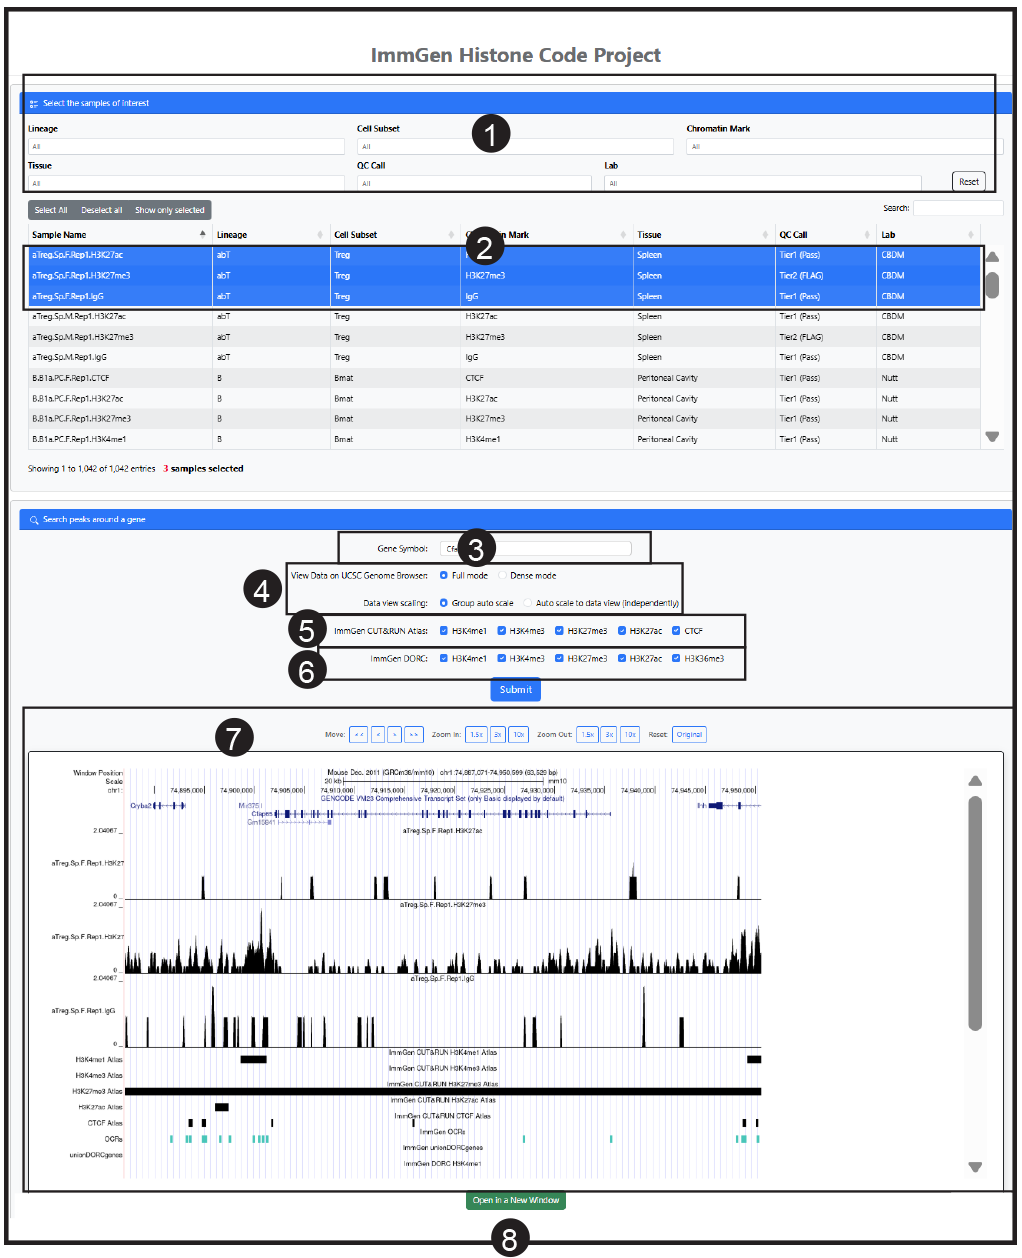
8 For more details, open a new window to visualize directly on the USCS portal. Once there, use all the functionalities of the UCSC browser, to change the representation parameters (scale, relative position), or to put the data in relation to the wealth of additional information is available there.
For more details on the UCSC browser:
genome.ucsc.edu/goldenPath/help/hgTracksHelp.html