Yoshida et al predicted which Open Chromatin Regions (OCRs) are associated with each gene, based on correlation between expressionof the gene and OCR activity. This reference table lists the OCRs associated with the searched gene and their genome location.
OCRs are ranked and color-coded according to their relative gene activity score (color coding conserved in each panel).
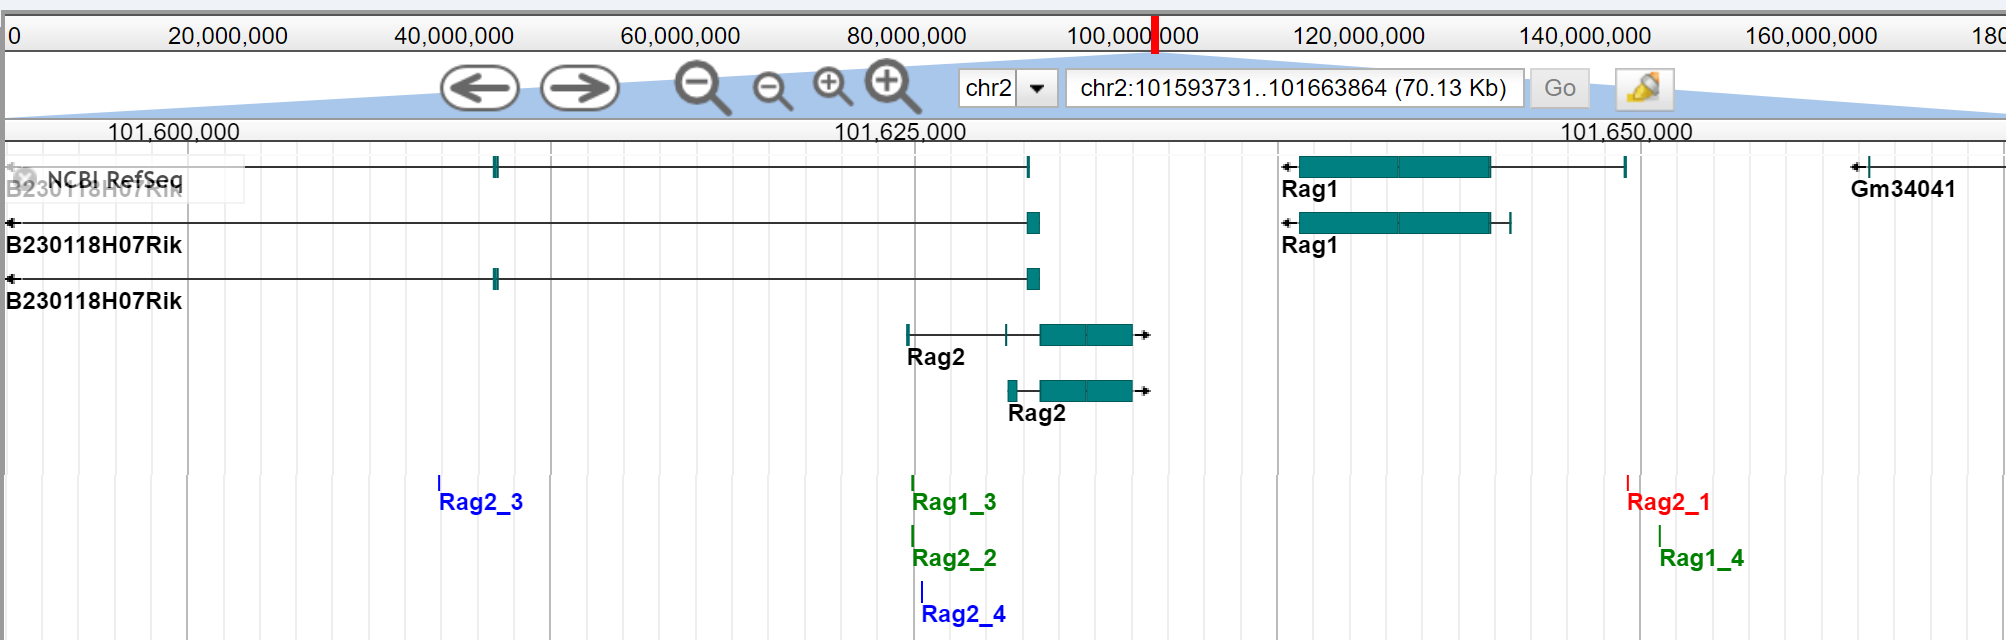
These OCRs are displayed at their chromosomal location, relative to the searched gene, on the JBrowse Genome Browser.
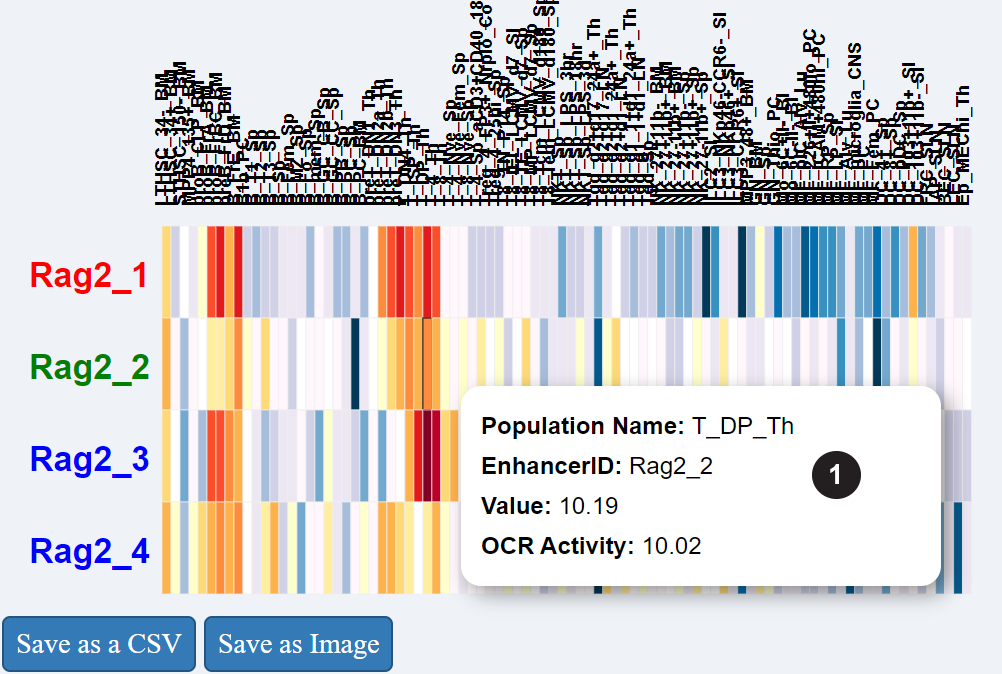
This heatmap presents the accessibility of the OCRs associated with the searched gene across all immune cell-types.
(1) Rollover the heatmap for details about cell-type and individual values.
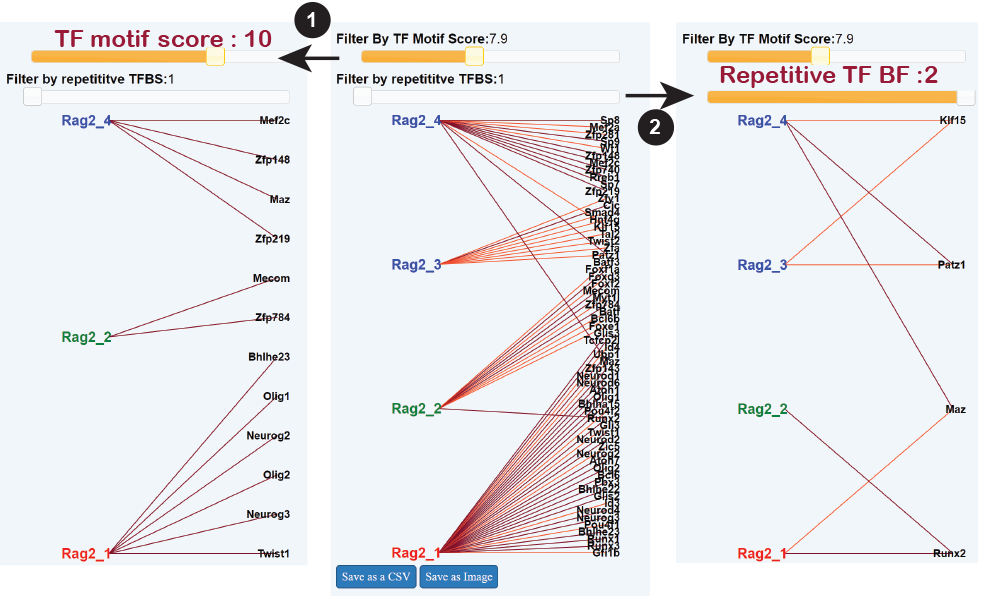
This panel displays transcriptions factors predicted to control the OCRs associated with the searched gene. All OCRs and predicted Transcriptions Factors are shown at first but can be refined according to the quality of the match of their binding site within the OCR (FIMO score), or by selecting TFs which are predicted to control two or more OCRs associated with the gene.
Colors indicate the score of the predicted connections, per 1.
Network parameters can be adjusted to show:
(1) Strong connections only (select a mimimum score on the slider).
(2) TFs whose binding is predicted in several OCRs.
Please note "Motif score" and "repetitive TF" filters act independently.