Constellation
The Constellation view presents the genes whose expression is most closely correlated with a target gene, within a lineage or across the ImmGen landscape.
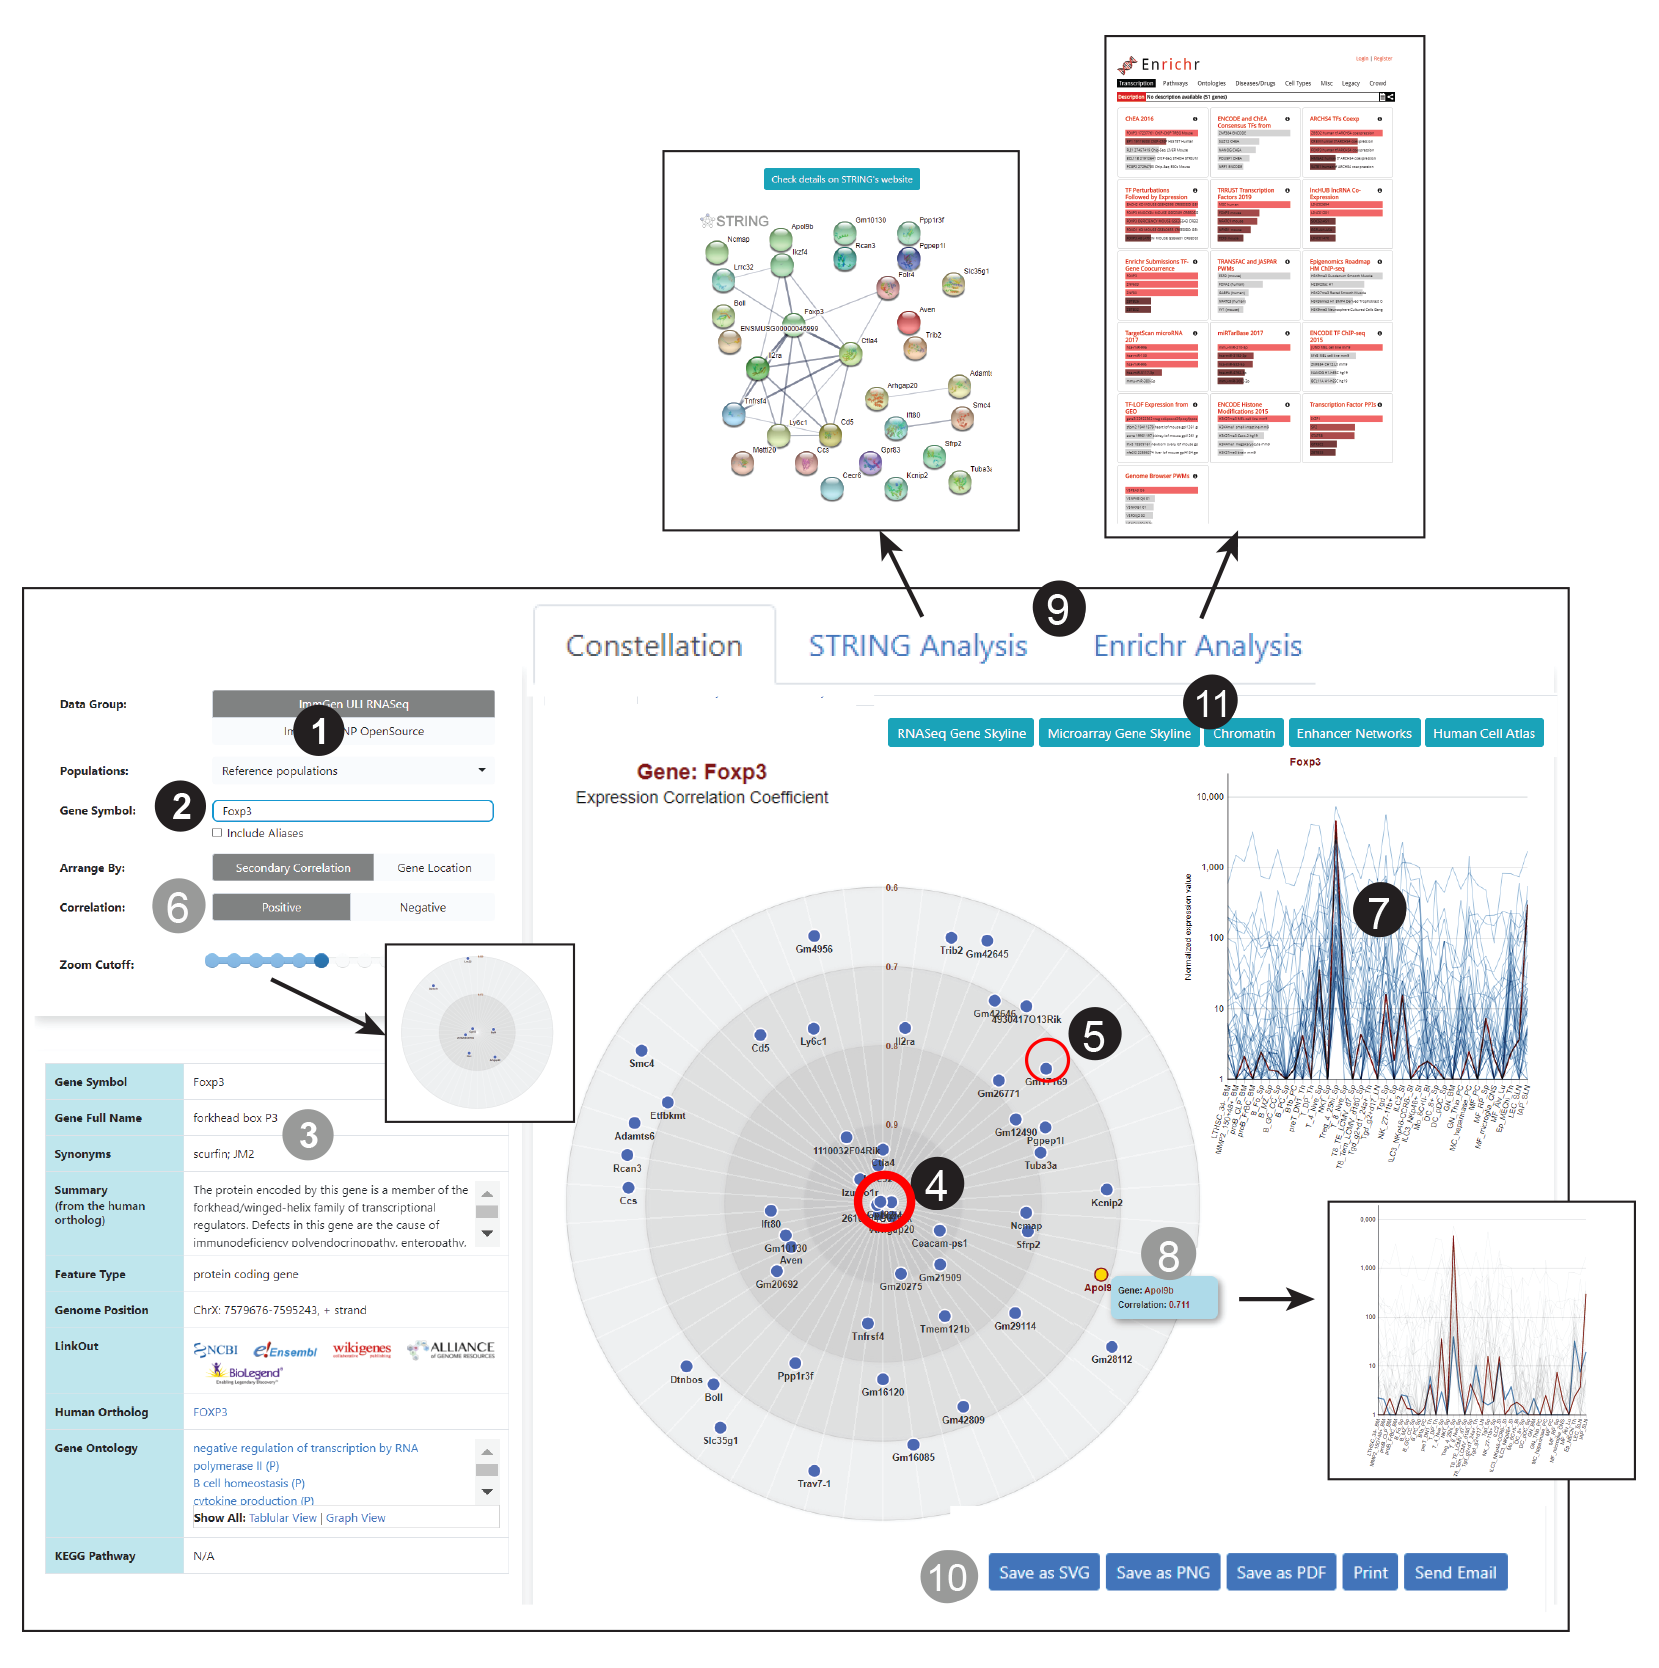
1 Select the range of cell types across which you want to test for correlation. The broad reference “reference population” used by default, will return correlations across the entire system, so pretty general. Correlations Within a lineage (B, T, myeloid) will be more discriminating.
2 Enter the Gene Symbol whose correlation profile you wish to display.
3 Basic annotation information on the gene and links to external databases are provided.
4 The chosen gene lies at the center of the constellation. The distance from the center represents the tightness of this correlation (closely linked genes are shown close to the center, more distant ones at the periphery).
5 Clicking on one of the genes will place it in the center and show its own correlations.
6 Adjust display parameters if needed:
- Angular positions on the circle can be set to display secondary correlations (default) or to represent chromosomal position within the genome.
- Choose positive (default) or negative correlation.
- Use the “zoom cutoff” setting to adjust the scale.
8 Rollover on a gene in the constellation view to highlight its expression profile.
9 Click on the tabs to select alternate visualization tools:
- The String database offers protein to protein interaction network analysis. Clicking on the tab presents a network based on the selected gene, open a new page for more detailed String analysis.
- Enrichr identifies biological pathways that are enriched in a gene list more than would be expected by a large set of genes or proteins, and may have an association with disease phenotypes. providing various types of visualization summaries of collective functions of gene lists.
10 Click to save the constellation image (.svg, .pdf, png formats), print or email it directly (color coding conserved in each panel).
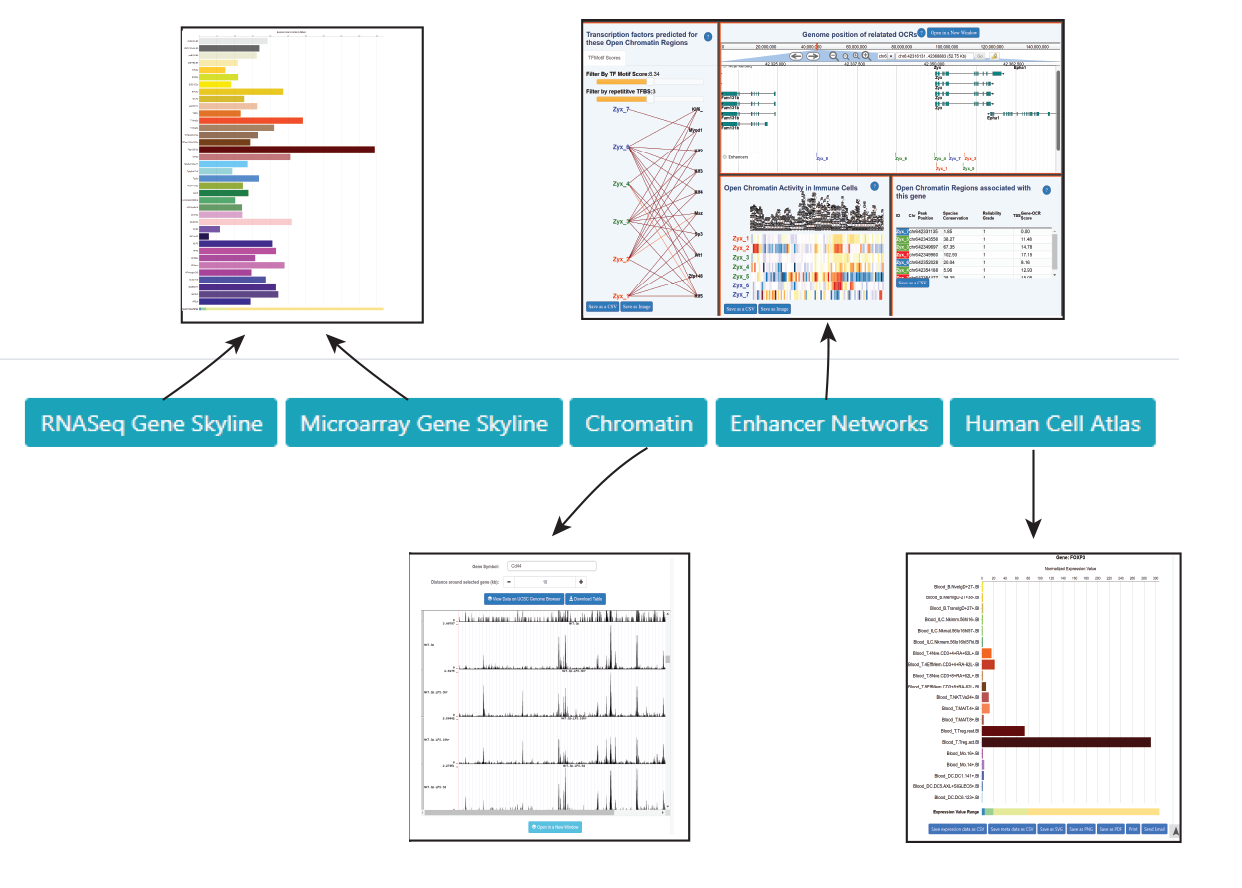
11 The constellation view offers direct links to a range of ImmGen databrowsers looking at the query gene from various angles (expression, Open Chromatin region/ enhancer analysis, human Gene of interest). Cell types/ lineages parameters are preselected whenever applicable. Click on the tabs to select alternate visualization tools :