
MyGeneSet
See how your GeneSet is expressed across ImmGen populations.
This browser allows you to examine the pattern of expression and interaction of a selected set of genes (up to 200) across some or all of the ImmGen expression data.
Gene Expression
Visualize the pattern of expression of your set of genes across some or all of the ImmGen expression data.
1 First select the type of data to browse (RNAseq, Microarray V1/V2) by selecting the corresponding tab (RNAseq by default).
2 Select the populations by navigating the ImmGen population tree.
3 Input a list of Gene Symbols: Either copy/paste a list, or drag/drop a file in txt format.
4 Click to choose one of these representations.
- The Scatter plot 5 shows the means-normalized expression value of each gene in each of the selected cells. Toggle between the Dotplot or Boxplot 6 and local/ global scale 7.
- The Heatmap 8 in which the order of genes or populations can be rearranged. Expression is color-coded (normalized to gene-wise mean).
9 Download the associated data.

1 Select the String network tab.
2 Input a list of Gene Symbols as above.
3 Click the Submit button to display the network created by your set of genes.
Open a new window to visualize directly on the String website portal. Once there, use all the functionalities of change the representation parameters put the data in relation to the wealth of additional information is available there.
For more details on String:
https://string-db.org/cgi/help?sessionId=bOIEjPu4mW6E
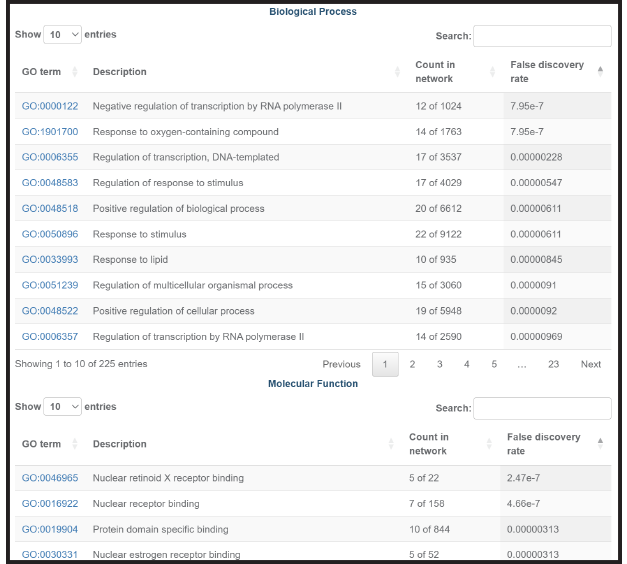
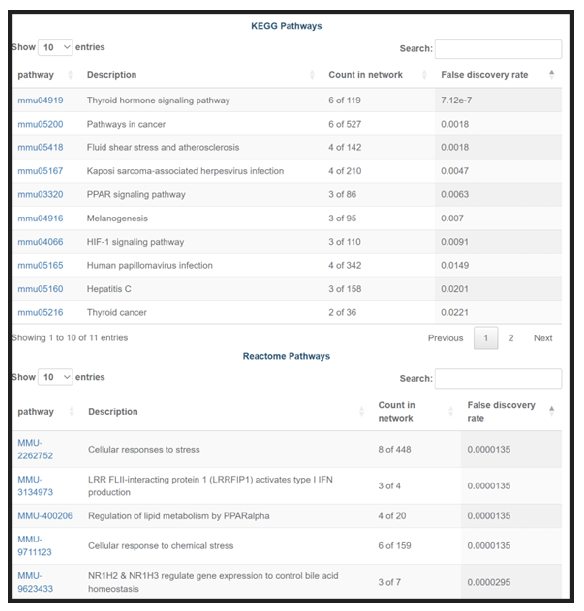
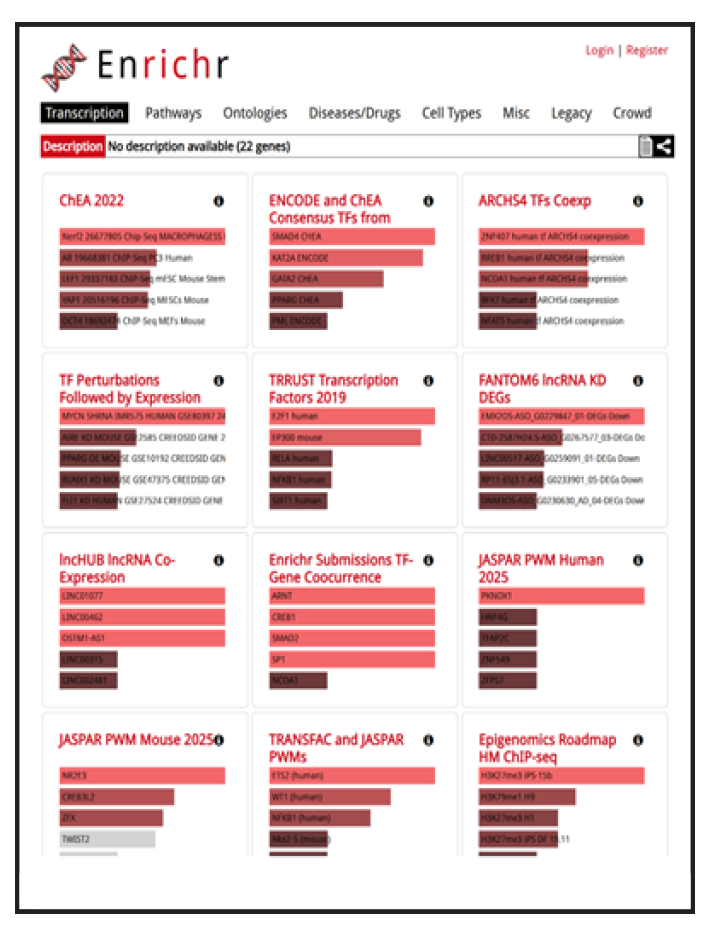
In addition, several buttons can retrieve enrichment analysis for your gene list.

 This tool lets you find, for every gene in your GeneSet, the publications in which this gene is mentioned together with a “search term”. The search term can be anything, but the tool is typically used to relate genes and cells, such as "Which of these genes are co-mentioned with dendritic cells."