Gene Expression Map (GEM) help
The Gene Expression Map is a GoogleMaps representation of activity throughout the genome.
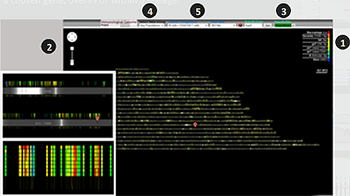
Gene expression levels in a few representative cell types are visualized as pseudocolor barcodes positioned on the chromosome map (arranged as shown (1)). Use the usual Google zoom and navigation controls (2) to move around the genome. It is also possible to land on a particular gene through a search field (3).
Other controls include the choice of populations displayed (4) and the ability to highlight genes showing differential expression to identify regions of correlated expression (5).
Caution: Please use Firefox, Chrome or Safari browsers, not effective with current versions of Internet Explorer.