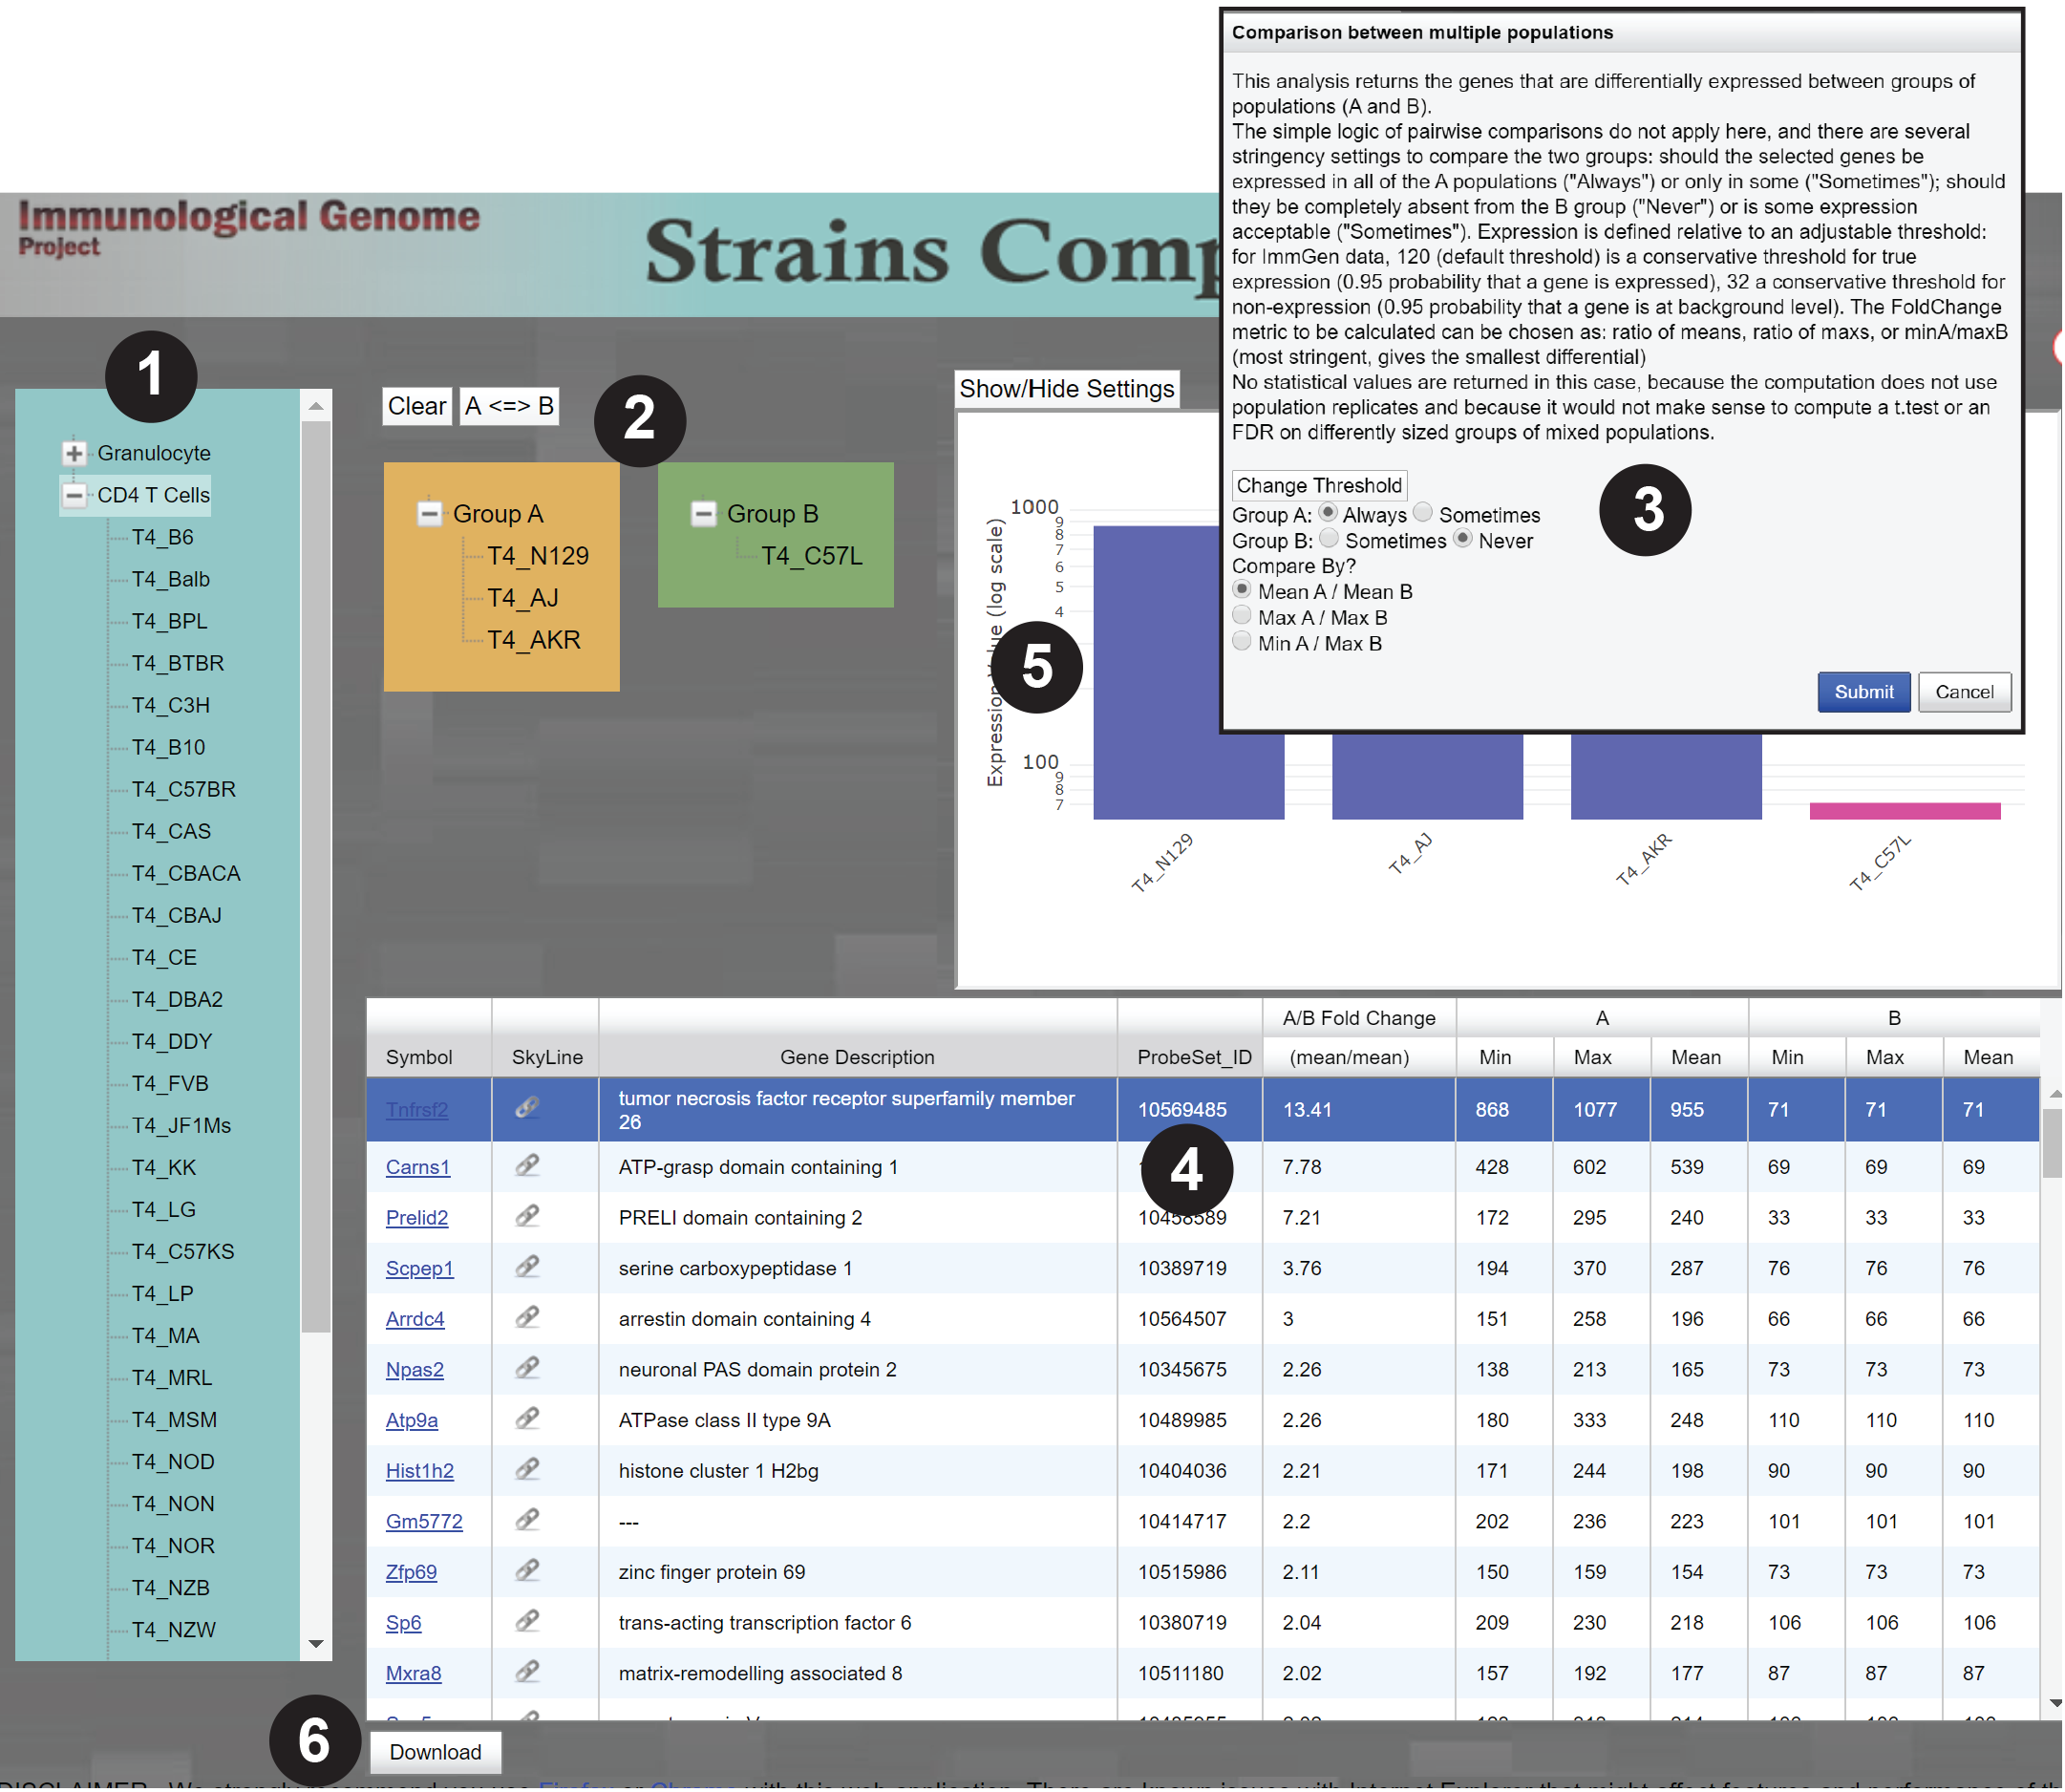
Select the strains to be compared by navigating the population trees for either splenic CD4+ T cells or bone marrow Neutrophils (1), then drag-and-drop the chosen population(s) into either the Group A or Group B box (2). Each Group can have one or more strains. Click Submit (3), if necessary after adjusting the comparison parameters.
Returns a table (4) of the genes that are over-expressed in Group A relative to Group B, ranked by FoldChange (to flip the comparison, use the A< >B button at top).
Clicking on one gene brings up a plot of expression values across the selected cell-types (5). The table can be downloaded (6).
Caution: Please use Firefox, Chrome or Safari browsers, current versions of Internet Explorer cannot fully support this browser.

